Product
December 21, 2023
Announcing Artemis Stablecoin Dashboard
5 takeaways on which chains + stablecoins are growing marketshare in Dec '23
.webp)
Jon Ma
Co-Founder / CEO

Nirmal Krishnan
Head of Engineering
5 takeaways on which chains + stablecoins are growing marketshare in Dec '23
Today we are excited to share and announce the Artemis Stablecoin dashboard.

We previously highlighted why stablecoins are poised for growth, especially in countries with high inflation rates and high demand for U.S. dollars. Additionally, we continue to see more use cases for stablecoins outside of just investing & trading and believe stablecoins are a killer use case in crypto.
Some examples of exciting applications leveraging stablecoins:
While this may not be the first stablecoin dashboard in the crypto data space, our mission at Artemis is to bring transparency to crypto to help market participants understand what’s happening on-chain by providing a neutral data platform that allows analysts to compare and analyze assets like stablecoins. We were inspired to build our stablecoin dashboard to better understand and answer questions such as:
While we can only answer a subset of the questions above, we hope in future iterations to allow anyone to answer these questions with Artemis.
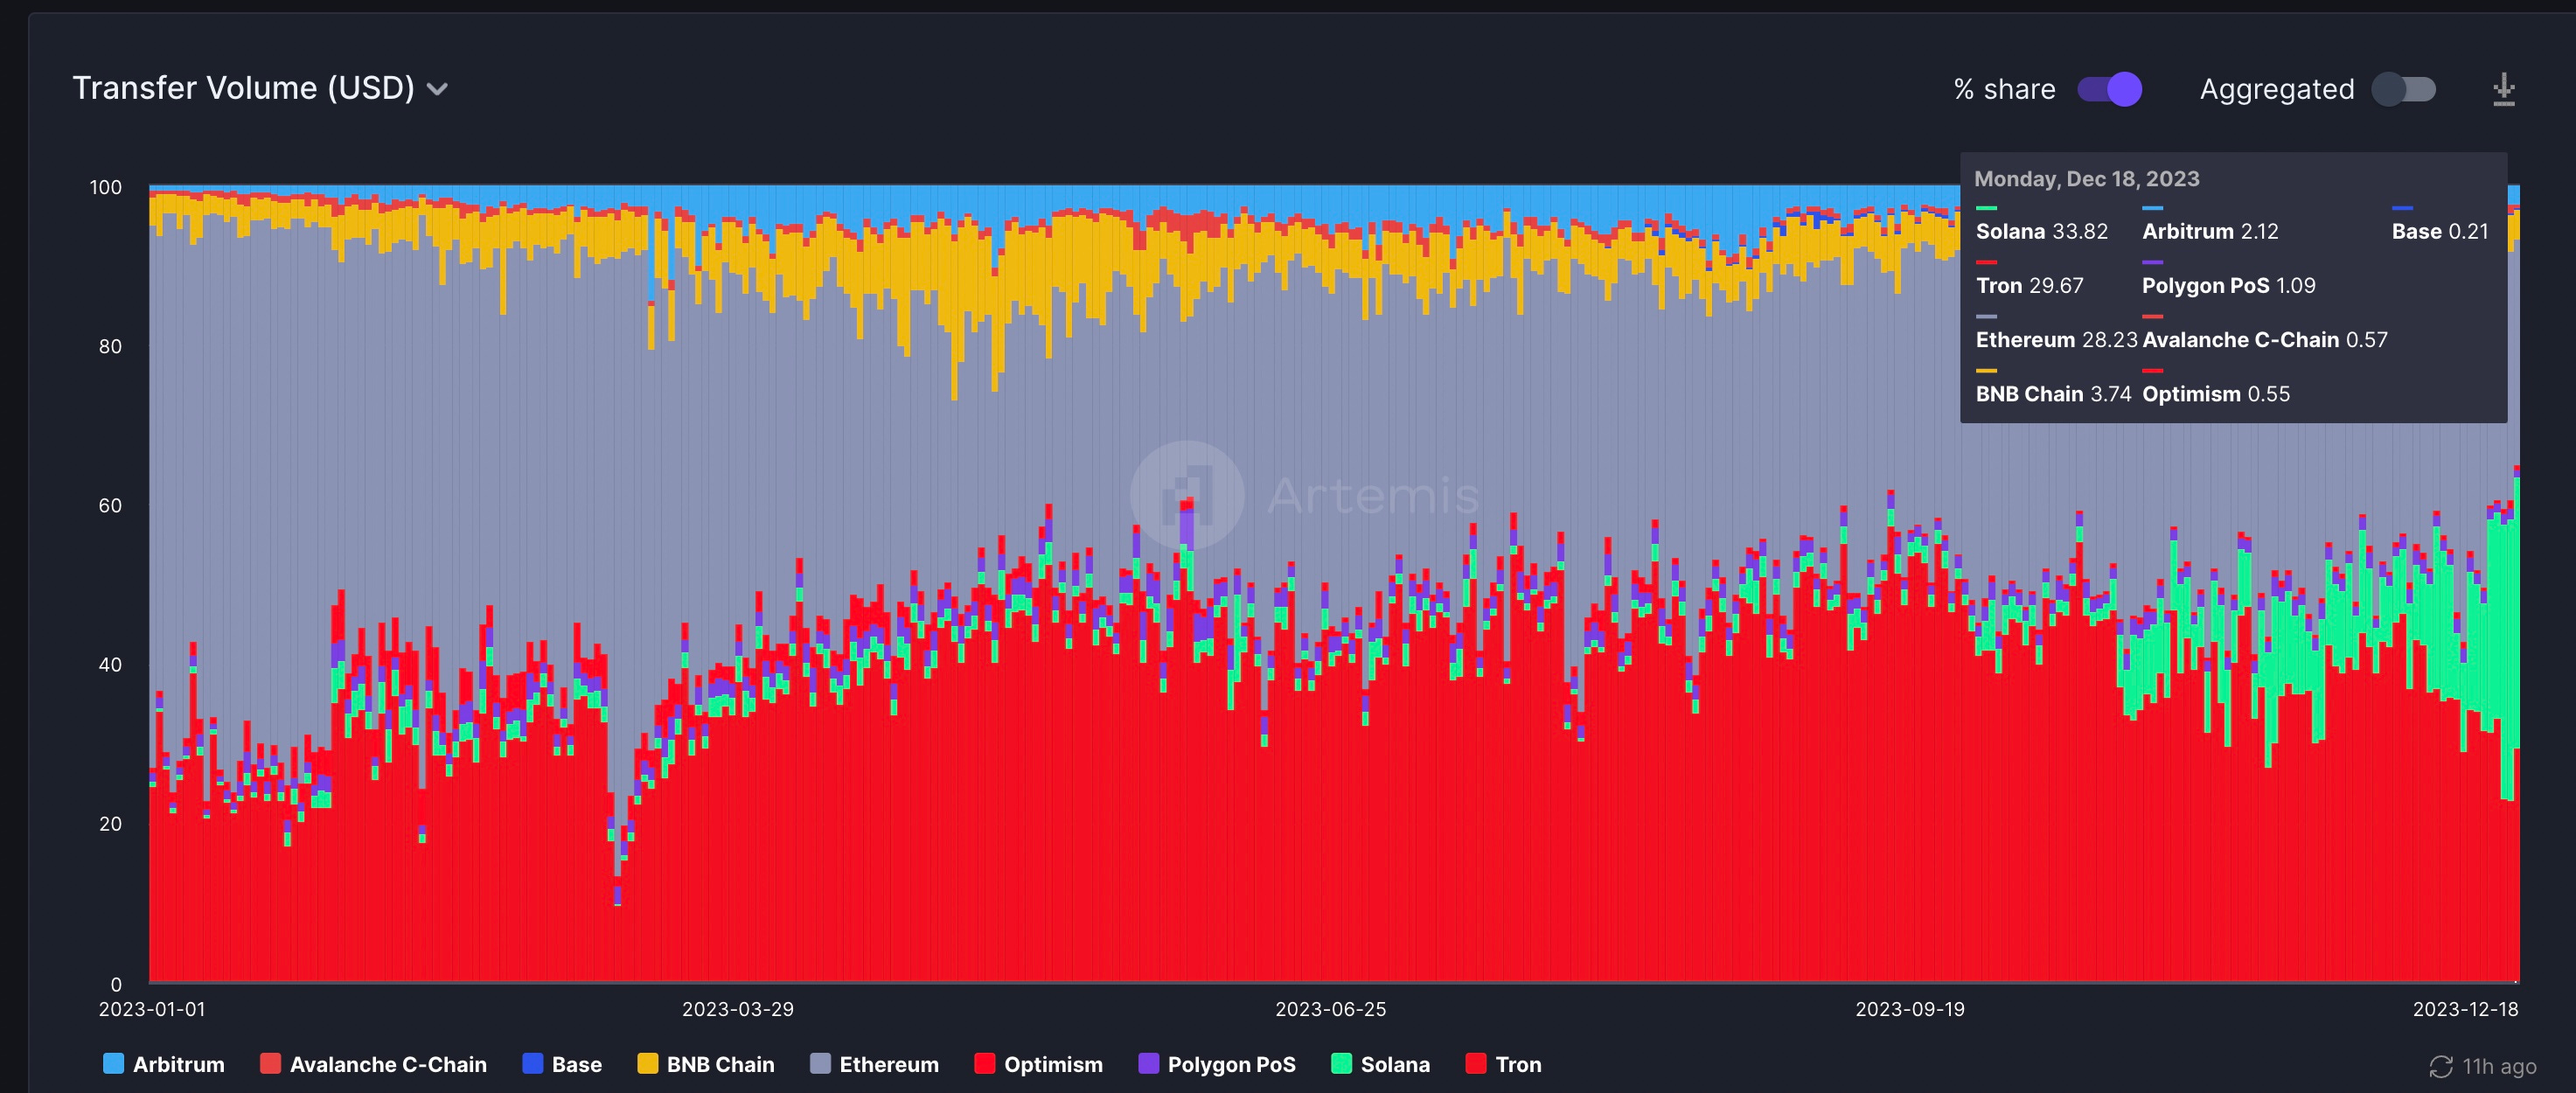
You’ll notice when comparing stablecoin transfer volumes across chains (the $ amount of wallets sending stable coins) that transfer volumes spiked significantly on Solana in the last 2 months.
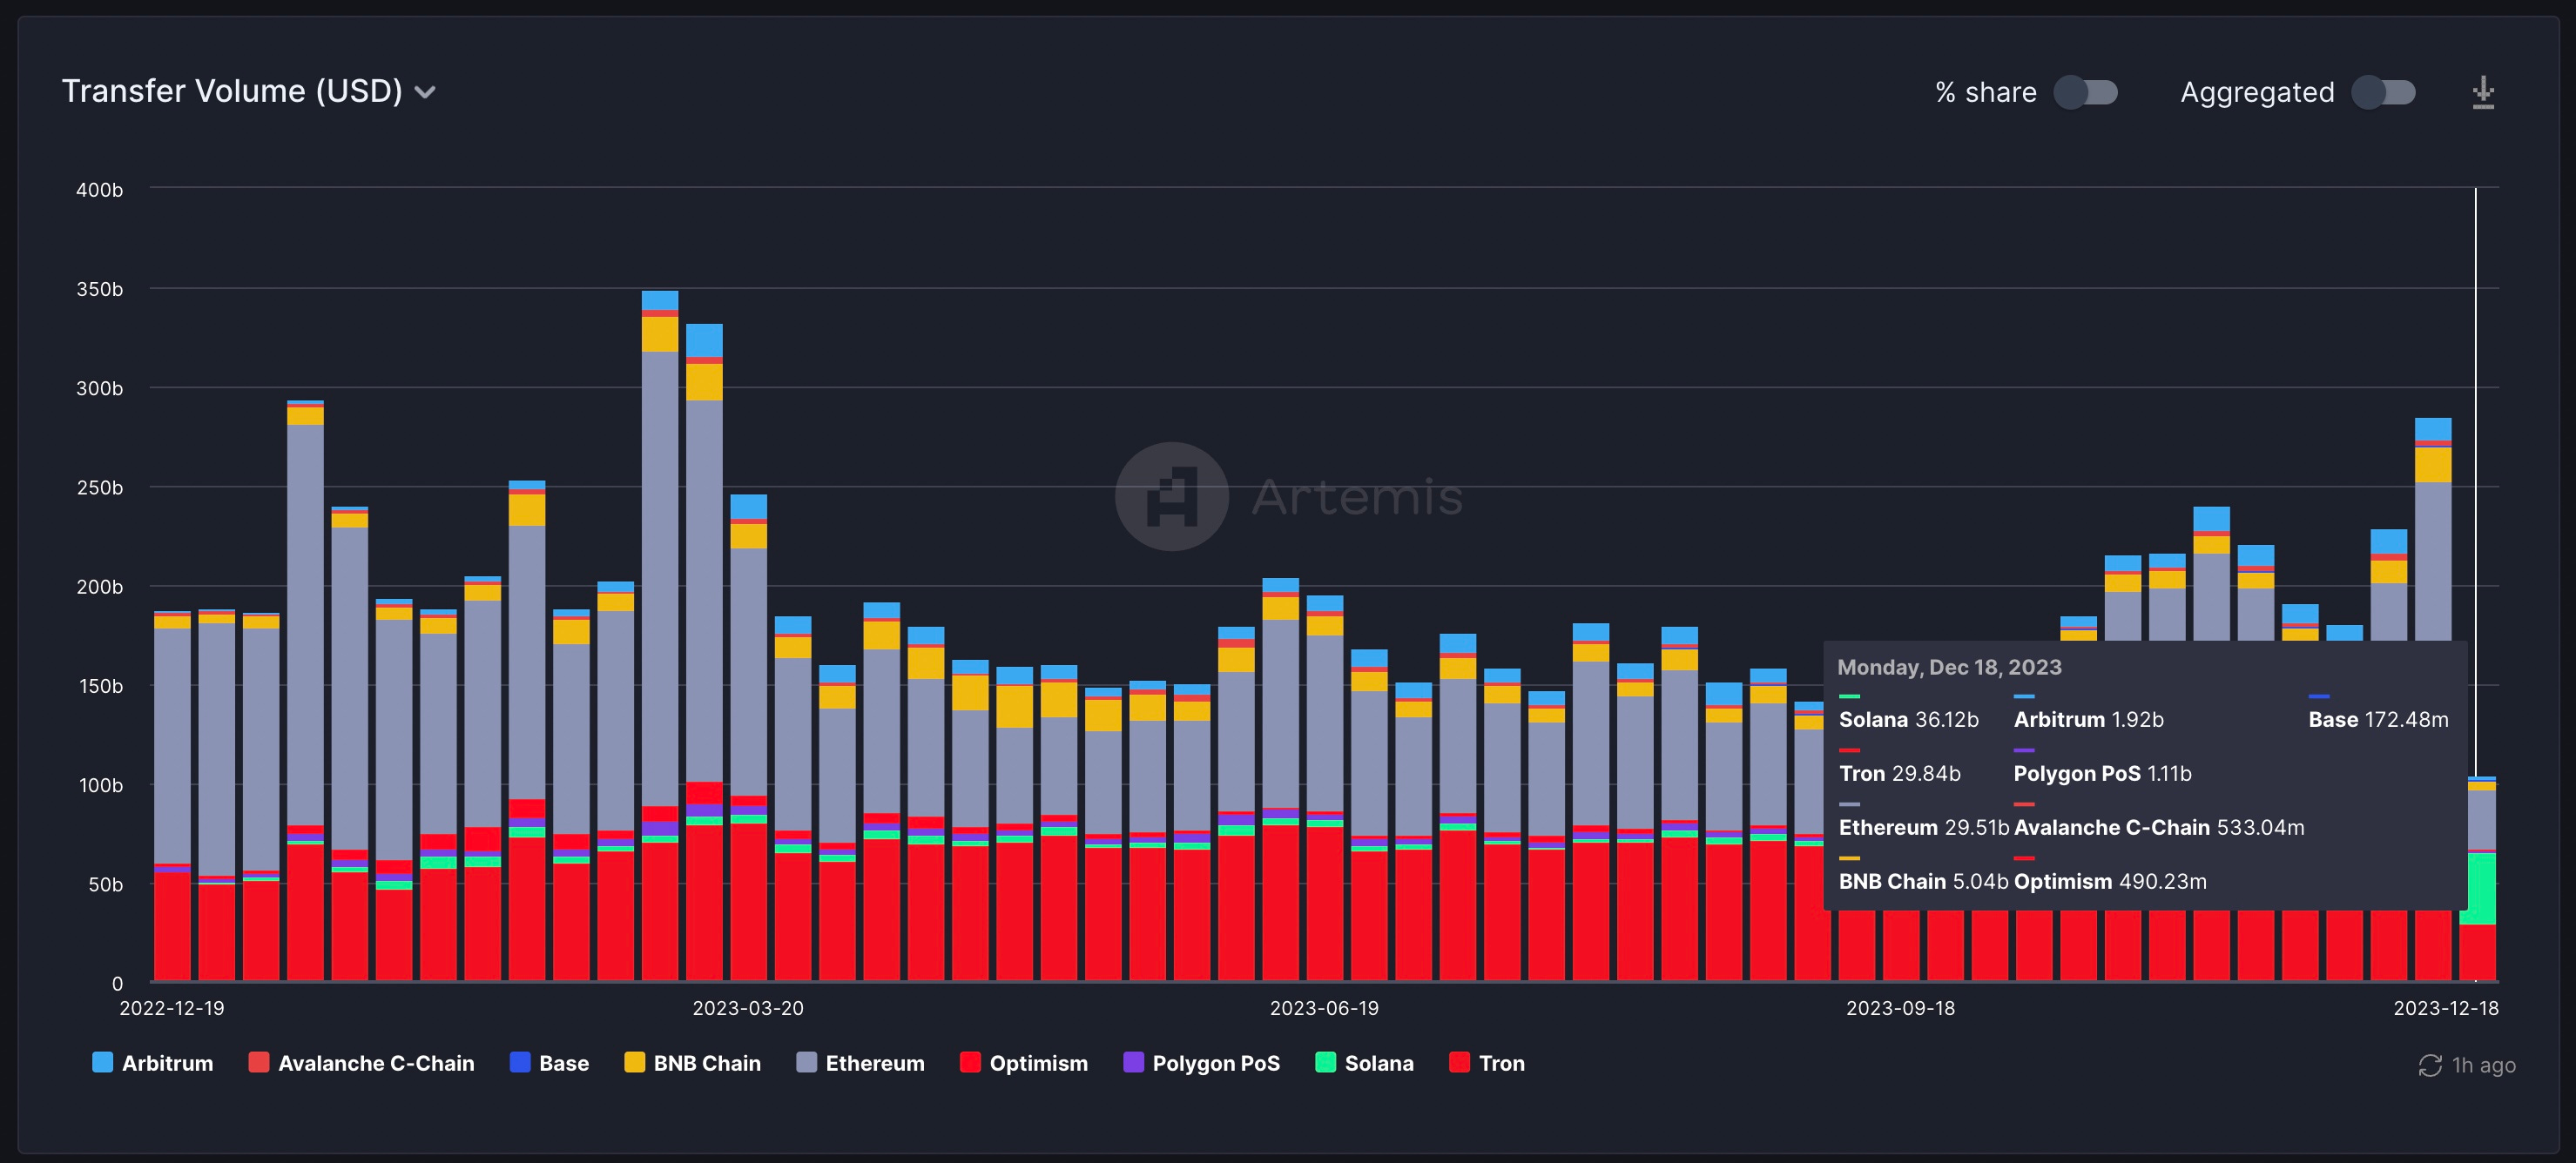
We see that Phoenix order books are accounting for a significant portion of USDC transfer volume (~$13 billion+ daily from our internal data which we’ll be surfacing as part of our “application activity” tab next). Phoenix is a fully on-chain DEX CLOB (central limit order book) with instant settlement. As a consequence, all orders, filled or not, appear to be posted on the chain and result in the growth of a significant portion of USDC transfer volumes we are observing in December.
Let us know and don’t hesitate to reach out if you have any questions here!


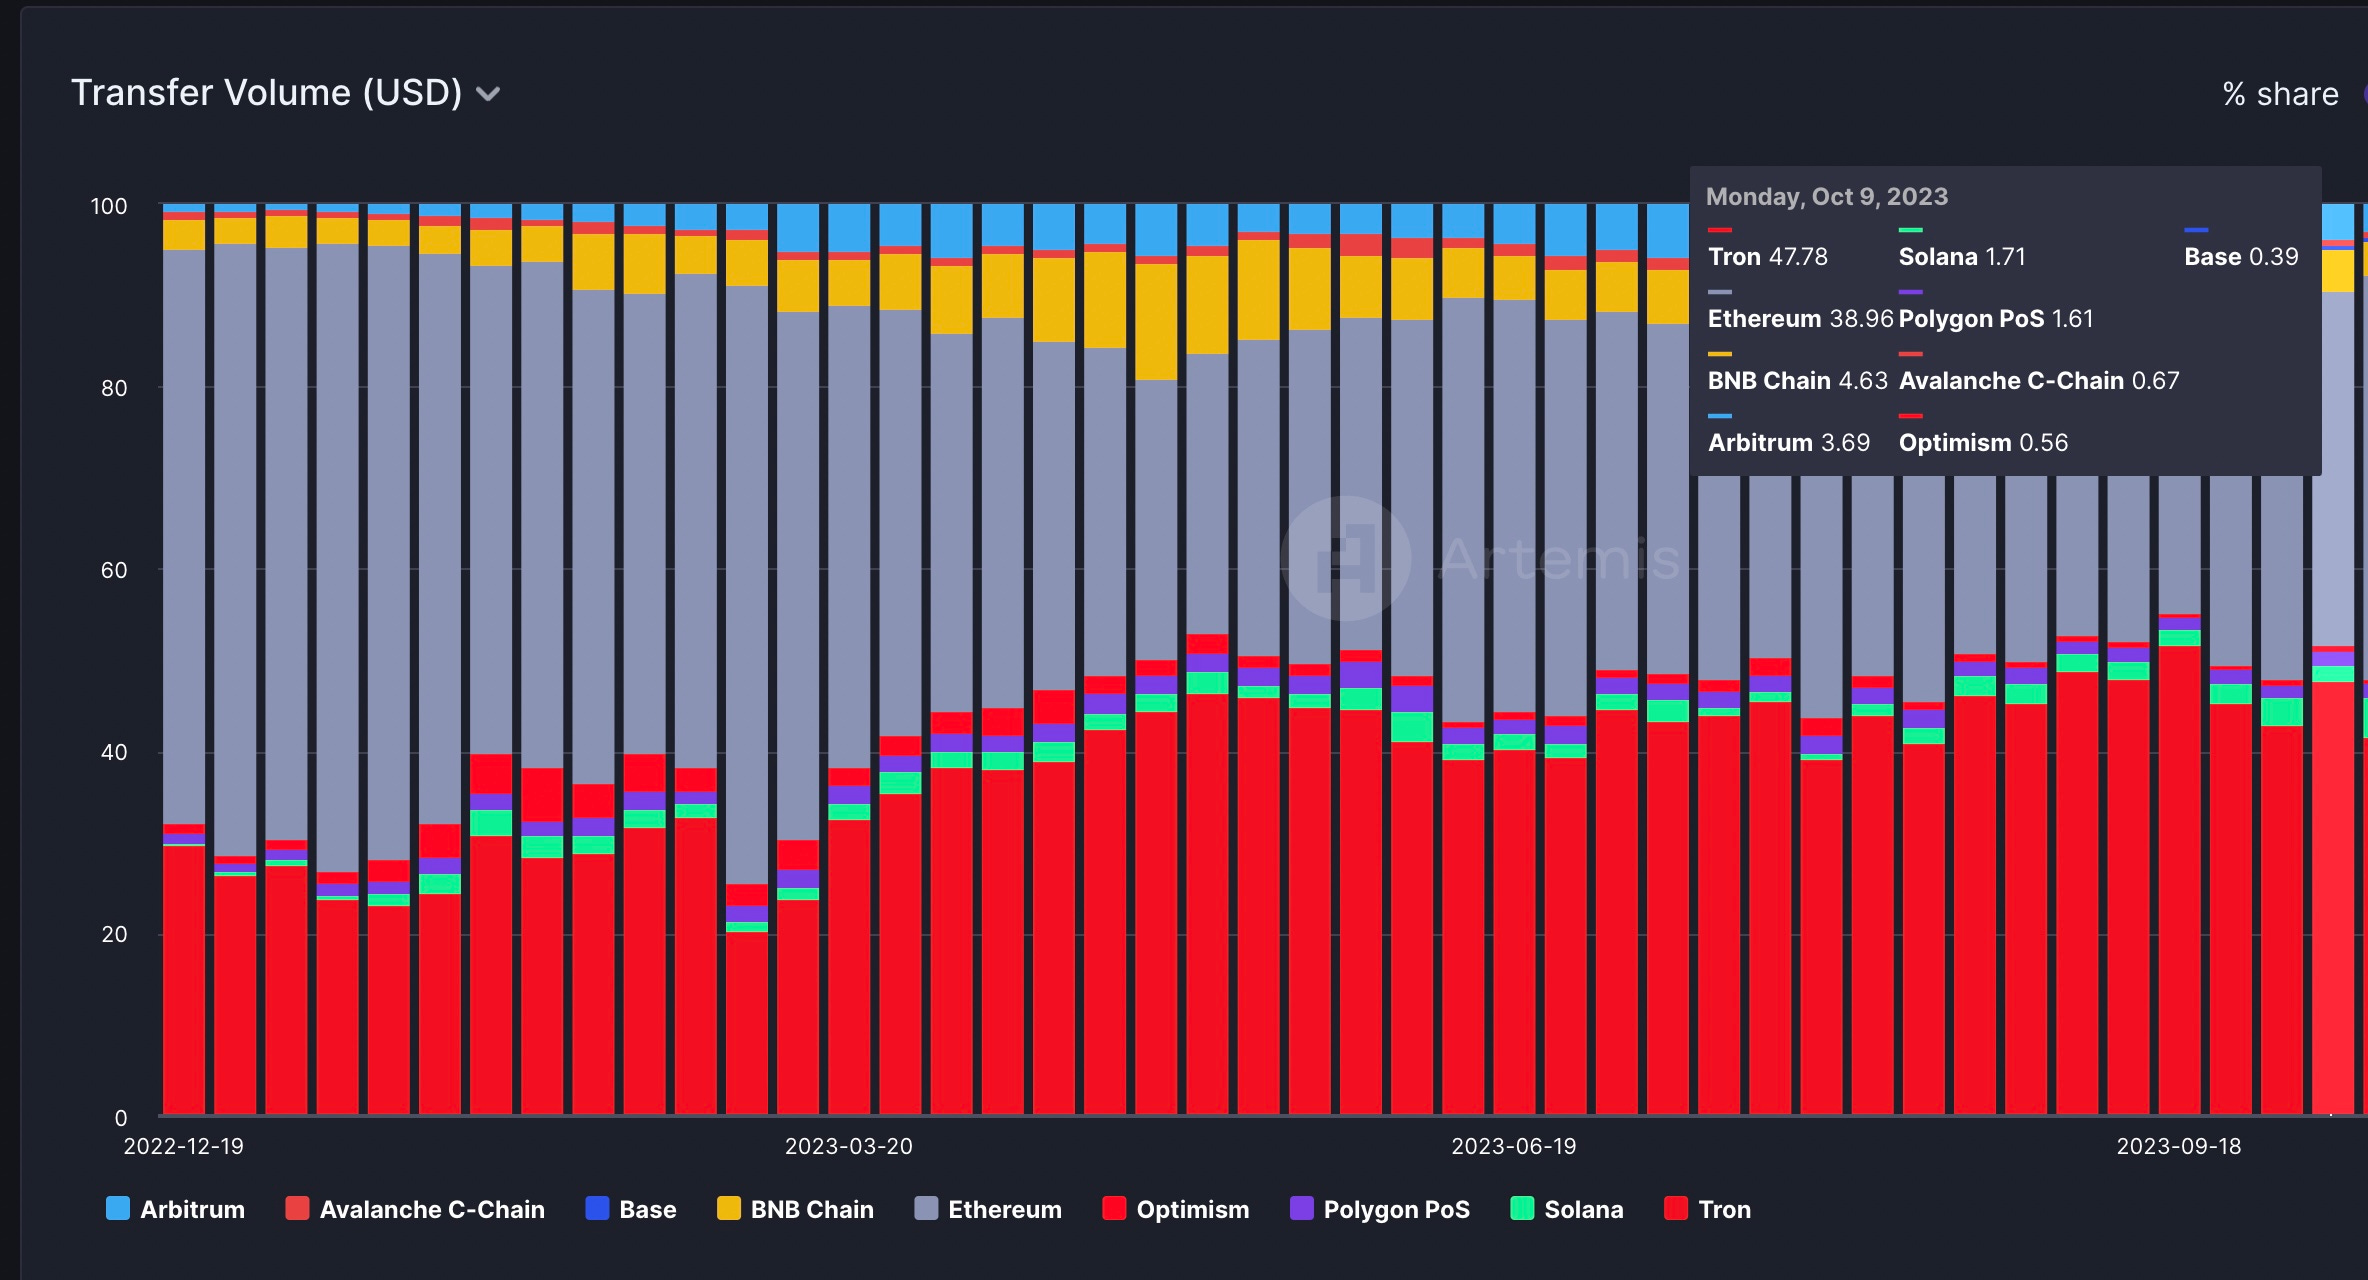
This isn’t surprising as there’s a lot of anecdotal evidence on X.com of contract manufacturers in China and in South East Asia paying using USDT, traders using Tron USDT because it is faster and cheaper than on ETH, underground market transactions merchants and individuals paying for goods and services using USDT.Tron market share of transfer volume went from ~20% in late 2022 to 52% at its peak in September 2023.
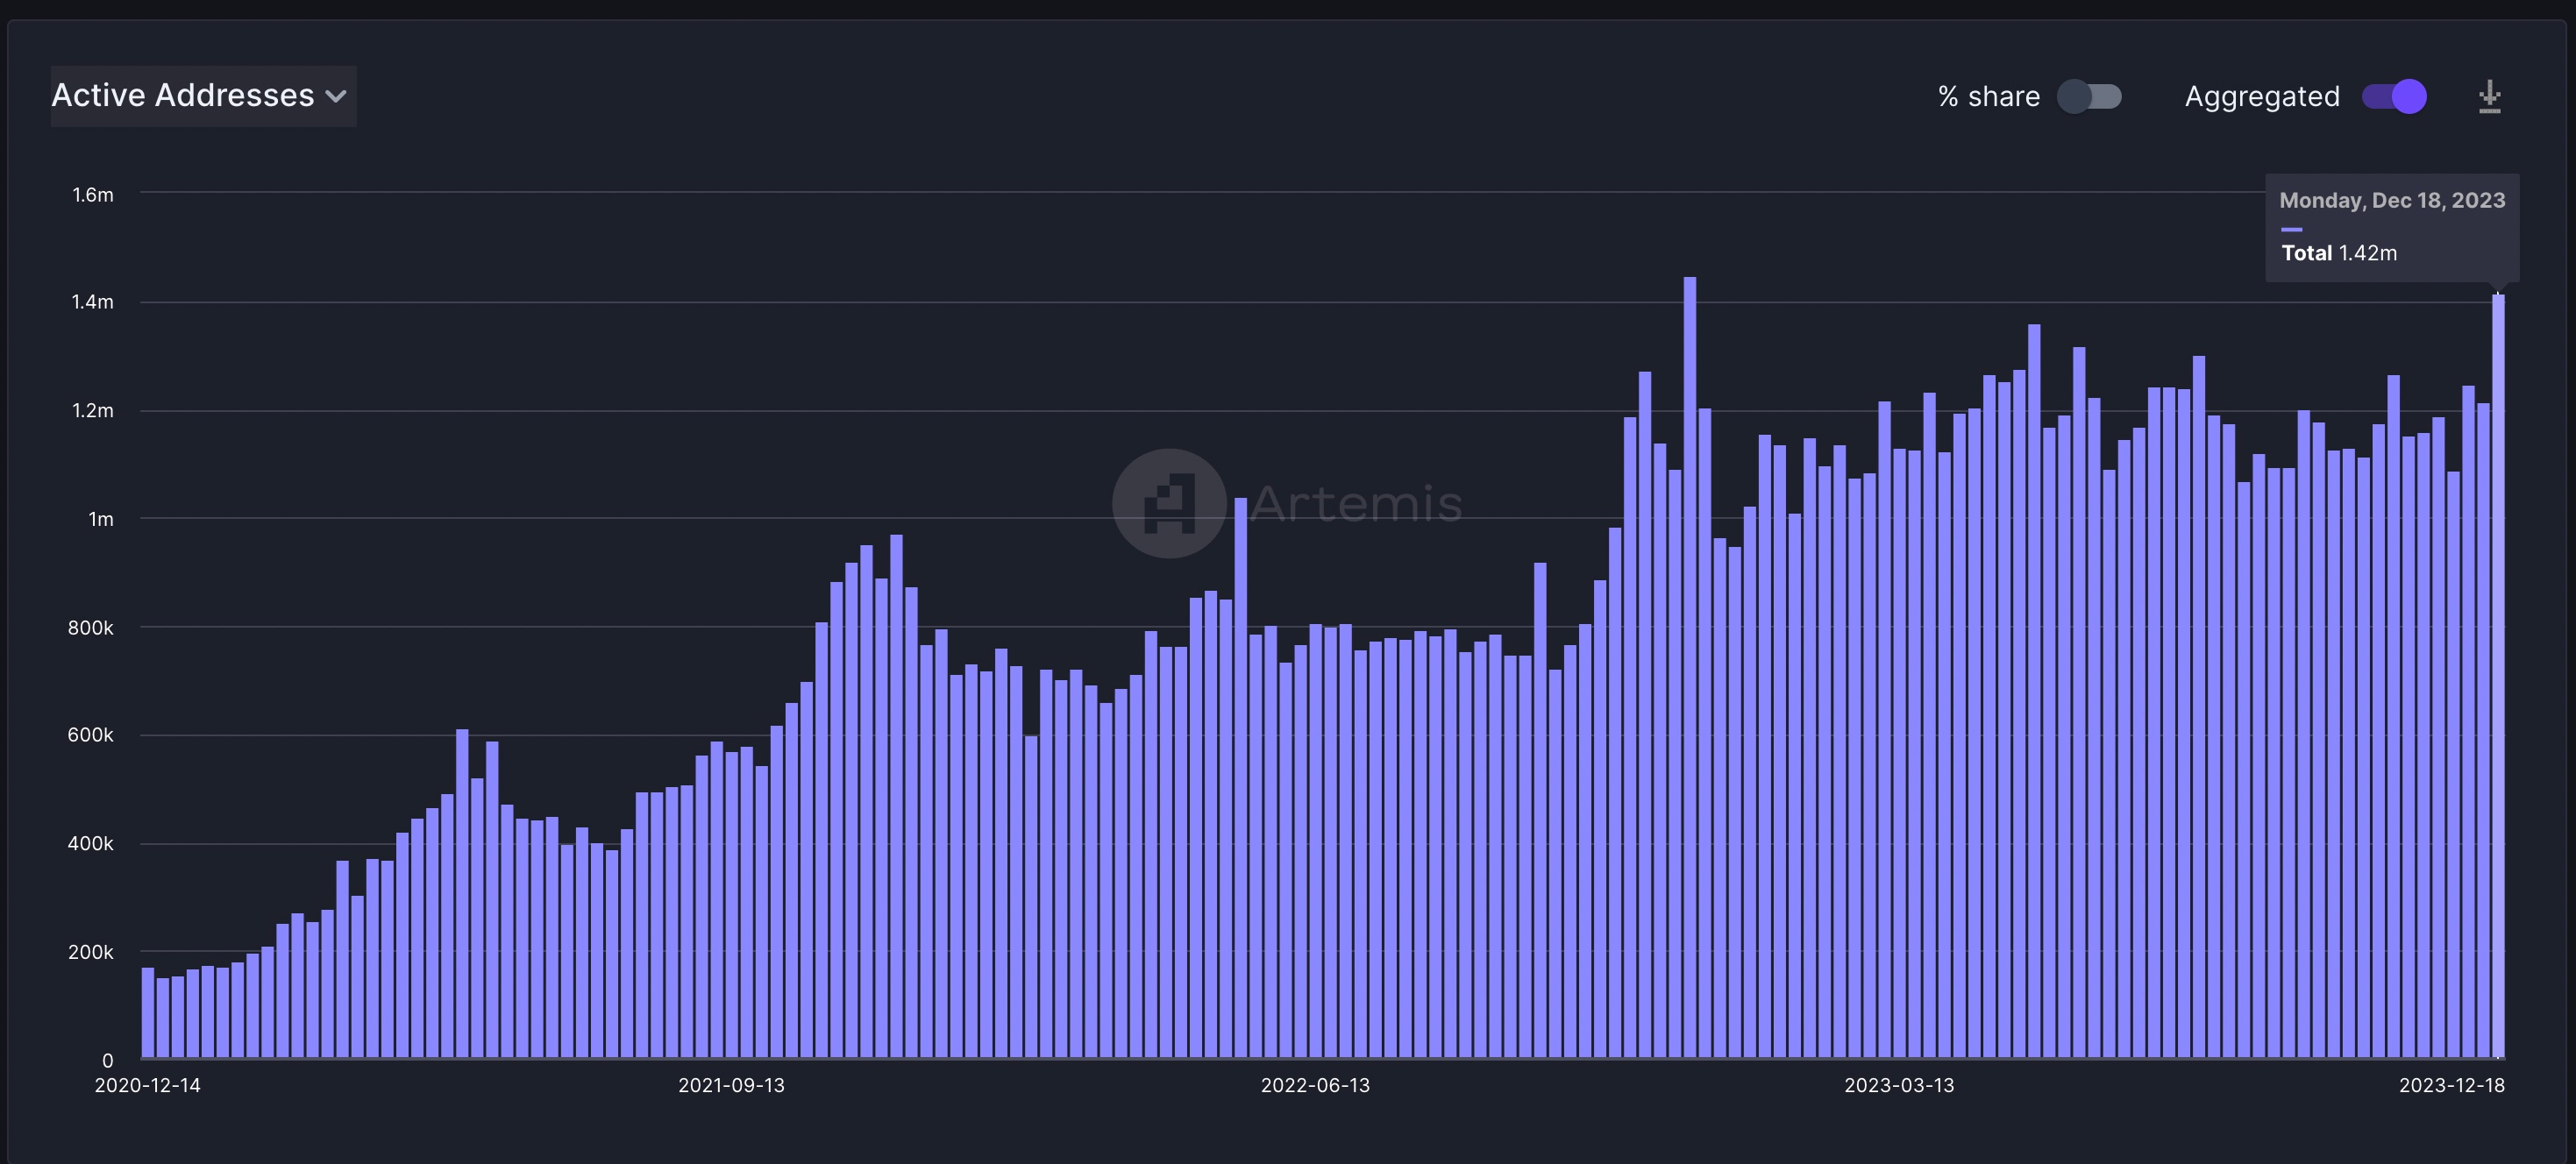
We hypothesize that the growth in Solana stablecoins was kickstarted by the JTO airdrop, which caused a significant wealth effect amongst users with ~$200M given away. This created more liquidity for existing users and an influx of new users searching for airdrops. This catalyzed DEX and NFT trading- SOL has flipped Ethereum on both metrics (DEX & NFT trading volume) in the last few days. Additionally, the growth of meme coins like BONK and WIF, which have historically never played out on Solana, has created room for more retail activity. Our hypothesis is the combination of these factors has resulted in significantly more on-chain activity, with Solana reaching its highest daily active address numbers since the summer of '22.The rise of CEX and bridge inflows into Solana further supports the growth in stablecoin adoption. The growth in on-chain activity buoyed interest in Orderbook DEXs like Phoenix Trade which we highlight in our Solana Transfer Volume methodology section.
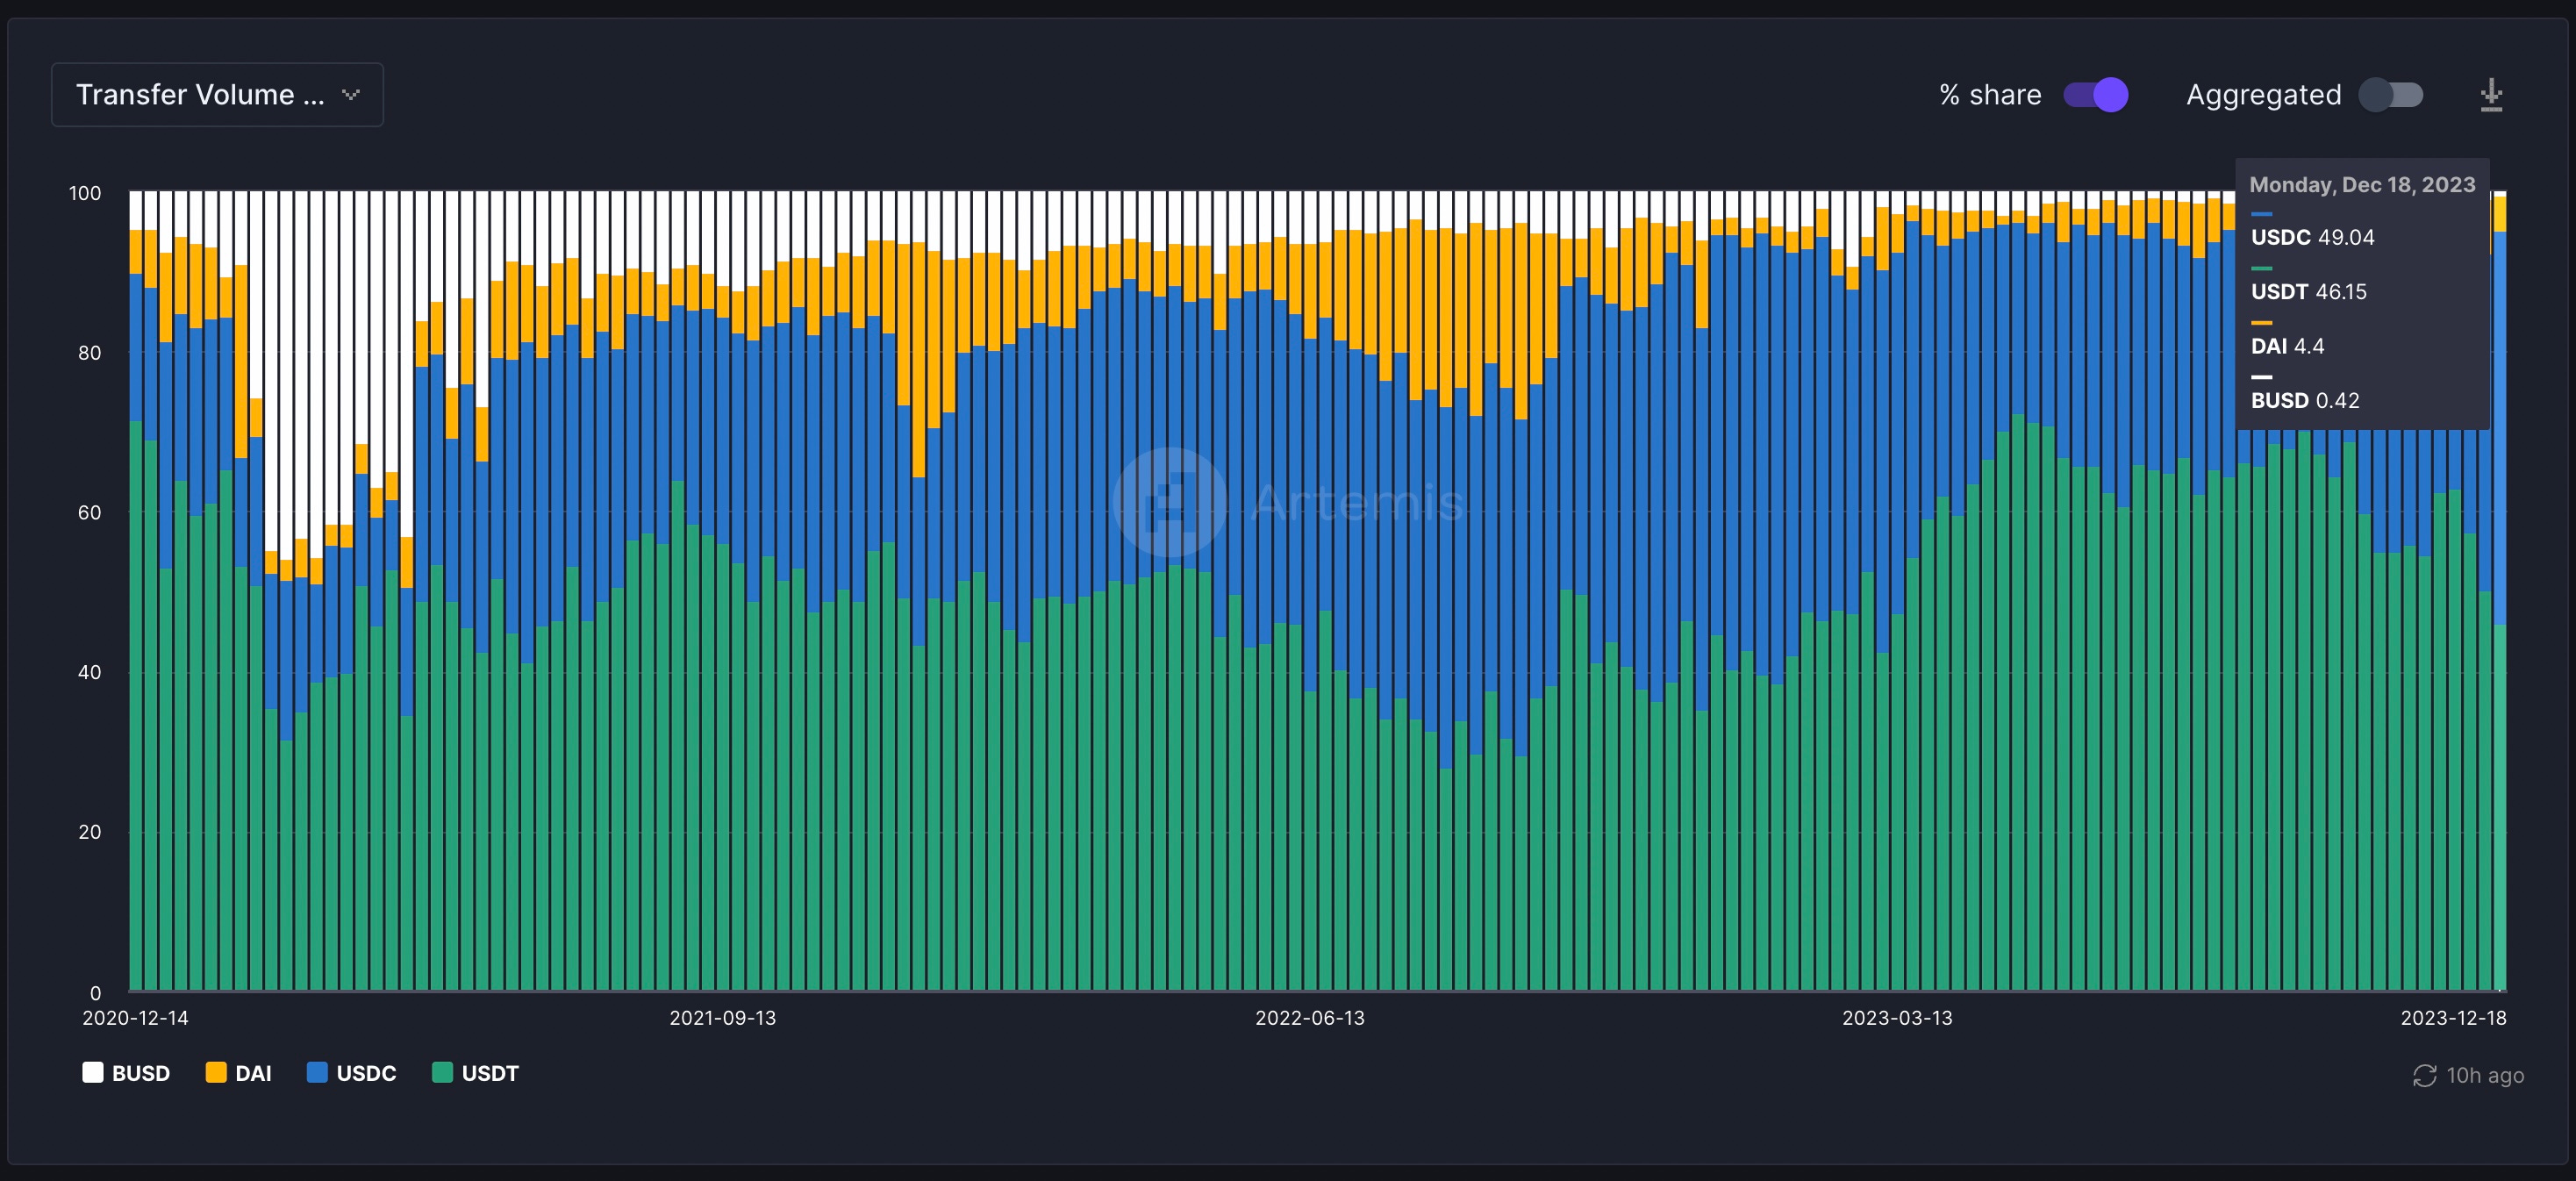
We believe a lot of the recent growth in USDC volume can be attributed to the rise of Solana USDC which reached ~$65b of transfer volume in the last week up from $2-4b 2 months ago. We document the rise in Solana USDC above and the role Phoenix Exchange plays as well.

Note: USDT is still 3.7x the supply of USDC so USDT is still the largest stablecoin by supply and market cap. However, our view is perhaps the “turnover” of USDC is higher than USDT and there’s more transfer volume per stablecoin on USDC.
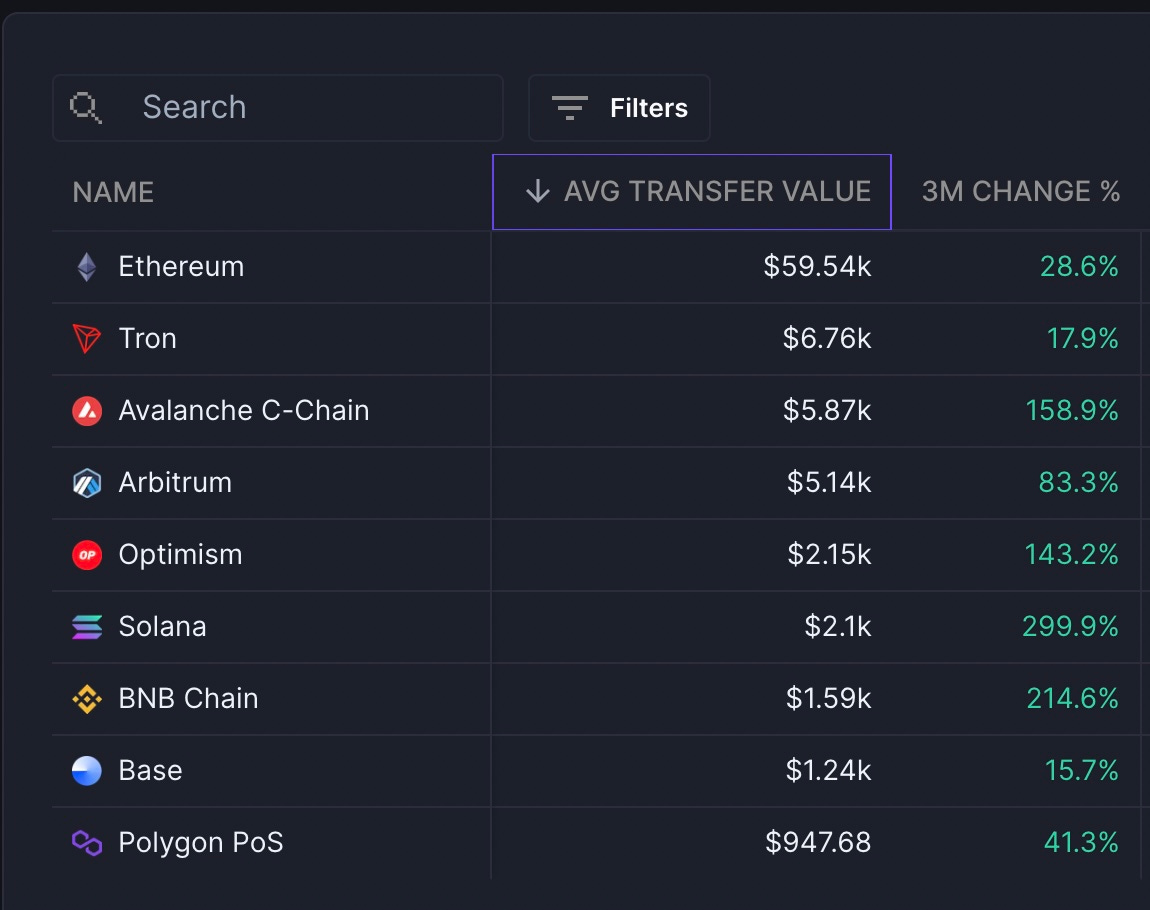
Avalanche, Arbitrum, Optimism, Solana, BNB, Base, and Polygon have roughly ~$1k - $6k in average transfer value.Our interpretation is that whales and exchanges still largely dominate stablecoin transfer volumes on Ethereum. And for traders or users that need to move in and out of positions on CEXs or DEXs on chains with lower fees, naturally, the average transfer values will be smaller and more frequent. We we surprised by the Tron average transfer value and hope to update our analysis with the median transfer value as well as a distribution of usage.
We plan to continue to add more stablecoins and to continue to upgrade our dashboard. Stay tuned!Have any feedback or additional metrics or chains you’d like for us to support? Please drop us a note here or on Telegram or X.com.
Disclaimer: The authors, affiliates, or stakeholders of Artemis may hold interests in the tokens or protocols mentioned in this content. This disclosure highlights potential conflicts of interest and is not an endorsement to buy or invest in any specific token or protocol. The content is for educational and informational purposes only and should not be construed as investment advice in any form. Readers should approach this information cautiously and consider their unique circumstances before making investment decisions. The views and opinions expressed are subject to change without notice, and Artemis bears no liability for any loss or damage arising from the use of this information.
Subscribe to our newsletter and understand what’s happening on-chain.