Roll-up economics pre / post EIP-4844 (Cody @ Spartan Group!), Avalanche’s New Social Application Stars Arena grows to ~10k daily active users within two weeks of launch, Analysis of Q3 YoY Change in Ethereum Gas Fees and Transactions
🌞 Roll-up economics pre / post EIP-4844 (Cody @ Spartan Group)
💫 Artemis Data Insights:
Avalanche’s New Social Application Stars Arena grows to ~10k daily active users within two weeks of launch
Q3 YoY Change in Ethereum Gas Fees and Transactions
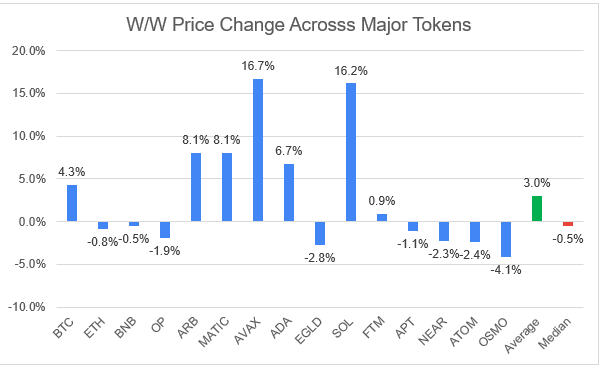
Overall L1 / L2 market prices saw an average WoW increase of 3.0%, while a number Alt L1 tokens including OSMO, ATOM and NEAR fell in price which dragged the median price of the ecosystem down ~0.5%. Meanwhile, equity markets chopped sideways (S&P 500 and NASDAQ index up ~0.6% and ~1.6% over past 5 days, respectively). BTC led the pack across major tokens (up 4.3% WoW), while Cosmos Ecosystem tokens OSMO and ATOM fell low to mid single digits over the week (down 4.1% and 2.4%, respectively).
🌞 Roll-up economics pre / post EIP-4844 (Cody @ Spartan Group)
Cody Poh at Spartan Group put together a fantastic article walking through L2 economics and the potential impact of EIP-4844 (using Artemis data!). Below, we summarize some of the key insights from his work (focusing on optimistic roll-ups).
Over the past two months, established optimistic roll-up platforms such as Arbitrum and Optimism generated a ~35% operating margin that is derived from two components:
Transaction Fees (Revenue): Layer 2 protocols generate transaction fees paid for by users within the Layer 2 ecosystem. When a user executes a transaction (e.g. mints an NFT, trades on a DEX, opens a position on a perp exchange) the user needs to pay a transaction fee (typically in ETH) to the network
Publishing Cost (COGS): The protocol then has to pay a cost in order to publish the transaction data of the activity that occurred on the layer 2 platform back to the Ethereum Layer 1 level.
Operating Profit: The protocol retains the difference between total transaction fees paid on the layer 2 platform and the cost of data publishing on Ethereum layer 1
Source: Cody @ Spartan Group. Current operating profit margins for optimistic roll-up platforms range from ~33% to ~63%
Important to note - transaction fees at the Layer 2 protocol (Revenue) increases as transaction count goes up, as more simultaneous transactions congest the network and push the cost of each individual transaction up.
In the graphic above, we can see that Base has a higher L2 execution cost / transaction than both Optimism and Arbitrum ($0.16 vs. $0.05 and $0.07), which indicates that Base was able to generate more revenue per transaction than its peers in that time period.
This specific trend was driven by the launch of viral social applications on Base such as friend.tech, which gained huge traction over the past few weeks and pushed up demand for transactions on the platform.
Cody notes that while fees per transaction (Revenues) increase on the layer 2 level, the L1 data cost per transaction (Cost of Goods Sold) remains relatively constant if there are not increased levels of congestion on the L1 side.
This means that there is meaningful operating leverage in the layer 2 business model - as transaction volume goes up, costs are relatively fixed and the platform enjoys higher overall operating margins.
EIP 4844
EIP 4844 is an upcoming Ethereum upgrade that aims to reduce the cost of posting data to Ethereum layer 1 (Cost of Goods Sold) by an order of magnitude of 10x+. This would mean that the current average cost of posting a transaction to Ethereum Layer 1 would come down from ~$0.10 to $0.01.
Source: Cody at Spartan Group.
Theoretically, this would meaningfully drive increases in Layer 2 operating margins if they maintained the same execution costs per transaction prior to the implementation of EIP 4844. In the example above, if L1 data costs (Cost of Goods Sold) were reduced by 10x, and L2 Execution costs were held constant, the Layer 2 protocols would enjoy operating margins of ~86% to ~95%.
However, Cody points out that it is likely that some cost savings to the Layer 2 protocol would be shared with users of the platform in order to incentivize usage of one layer 2 platform over another. While we don’t know exactly where layer 2 operating margins in a post EIP 4844 will shake out, it seems clear that consumers will benefit from this highly anticipated upgrade.
If you’re looking to learn more about this topic and also learn more about how ZK (zero-knowledge) roll-ups would be impacted by this upgrade - definitely check out the full piece here.
💫 Artemis Data Insights: Avalanche’s New Social Application Stars Arena grows to ~10k daily active users within two weeks of launch
Stars Arena is a decentralized social media platform that launched as fork of friend.tech on the Base network. Like friend.tech, Star Arena allows users to link their Twitter accounts to the platform and purchase “tickets” of other users using the AVAX token, with a percentage of the fees paid to both the platform itself and its users when tickets are bought and sold.
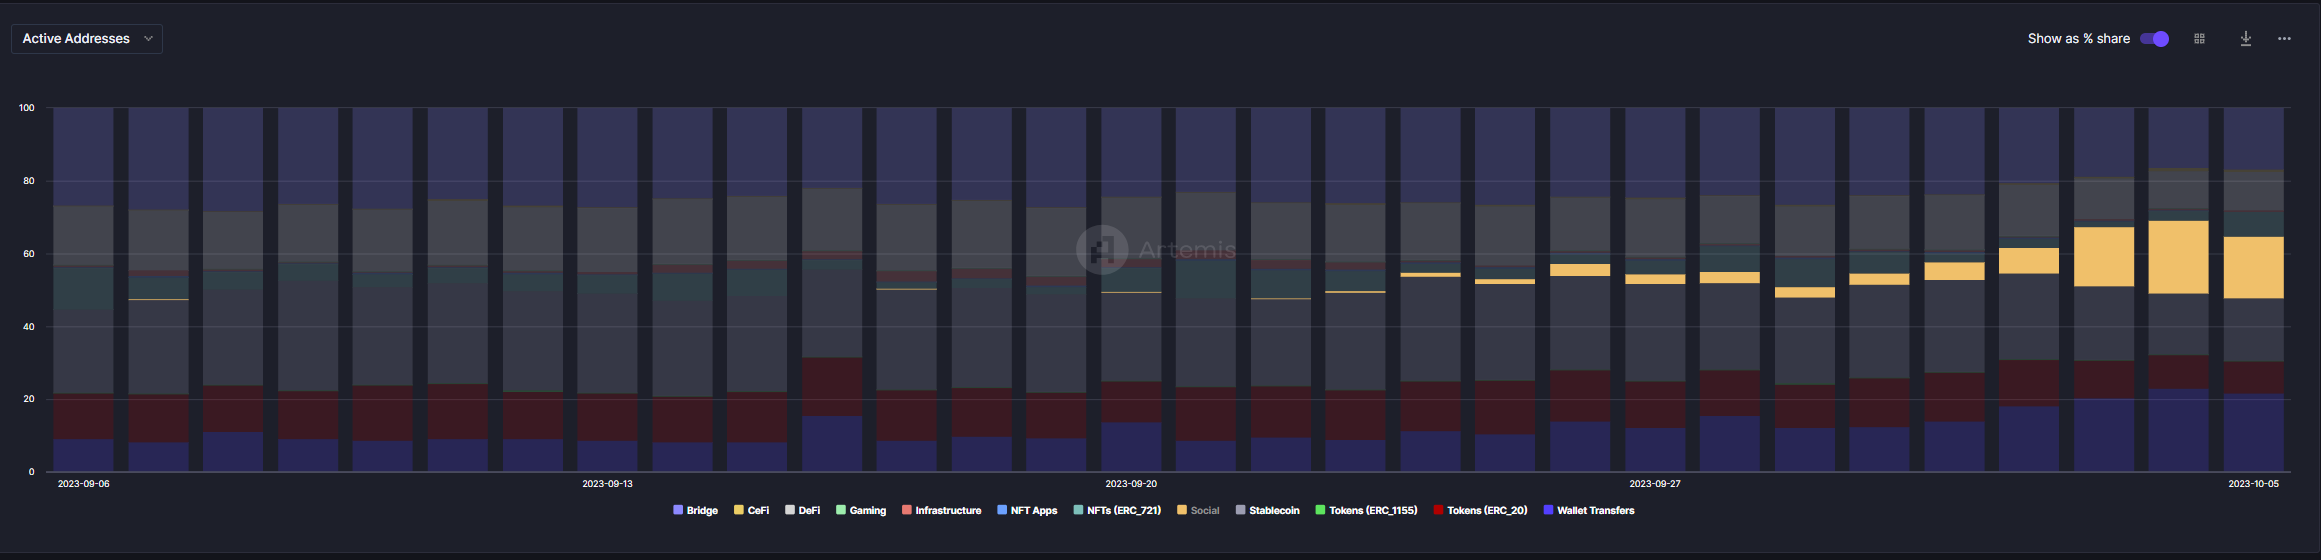
Star Arenas has taken the Avalanche world by storm, and the “Social” category has grown to ~15-20% of total daily active addresses on Avalanche after driving virtually no activity prior to Star Arenas’ launch.
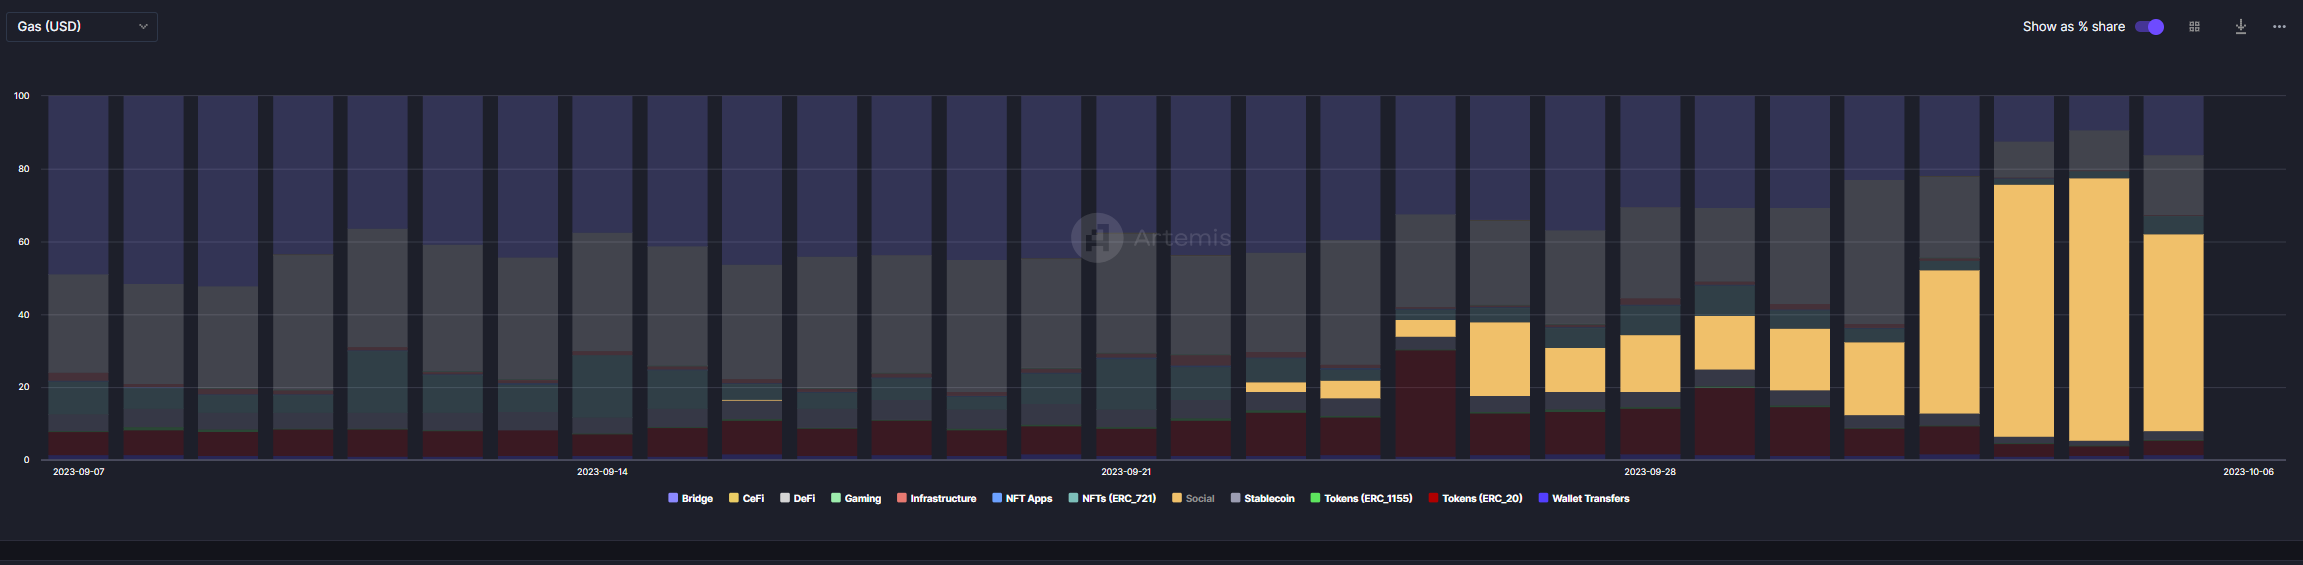
On a gas usage level, the difference is even more stark. The “Social” category grew to ~70% of total gas usage on Avalanche on two days after the launch of Star Arenas.
💫 Artemis Data Insights: Q3 YoY Change in Ethereum Gas Fees and Transactions
In Q3 2023, we observed that Ethereum transactions and daily active users have come down when compared to the same period last year (down ~18% and ~11%, respectively). However, fees (in USD) came up over the same period (up ~63% YoY). What gives?
Change in key metrics from Q3 2022 to Q3 2023 across selected blockchain networks
Firstly - the underlying price of ETH actually came up over that time (up ~16% YoY) period, which contributes to the stark increase in fees in USD. However, fees paid in the native ETH token were still up ~36% which was the more interesting finding.
After some digging, we came to the conclusion that while daily transactions declined across those two periods, the Fees paid in the native token (ETH) per transaction increased meaningfully over the same period. This indicates that ETH applications / users are paying more in gas per transaction in Q3 2023 vs. Q3 2022.
On this point, we note that Fees (Native) / Txn increased heavily in the L2 category between Q3 2023 and Q2 2022, as many L2 applications went live on Ethereum and the cost of transferring data and executing transactions on L2s accrued to Ethereum L1 gas usage (screenshot below). Gas usage / transaction increased heavily for the entire Ethereum L2 ecosystem that we cover, which appears to contribute to the lower transaction count but higher fees phenomenon.
Change in gas usage / txn from Q3 2022 to Q3 2023 for select layer 2 protocols
Artemis Product Update: Artemis Lite
Be sure to check out Artemis Lite - the fundamental analysis tool of choice for top investors within the crypto ecosystem!
Detailed L1 dashboardfor people who love more numbers in smaller font:
Note: Revenue represents fees that go to the protocol’s treasury or are returned to tokenholders via a burn mechanism (source: Token Terminal). Weekly commits and weekly dev activity as of 9/22/23.
The content is for informational purposes. None of the content is meant to be investment advice. Use your own discretion and independent decision regarding investments.
Crypto trends in your inbox
Subscribe to our newsletter and understand what’s happening on-chain.